
Dashboard
Build a flexible home page with widgets for tasks, time, calendars, and analytics.
Dashboards are the Leadtime home page. They give each user a personal overview of the information, tasks, and tools relevant to them when they open the app.
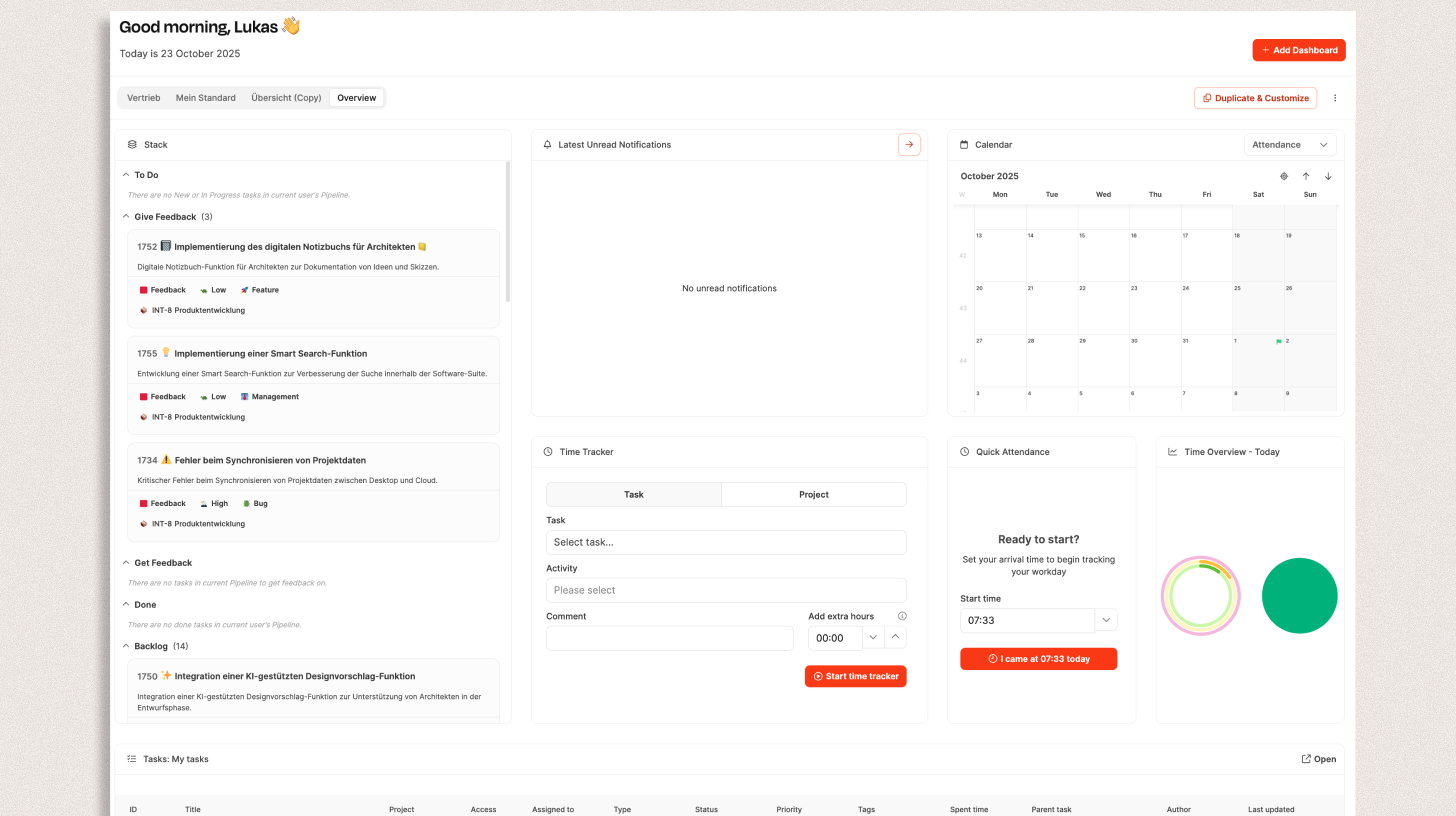
Create and customize as many dashboards as you need for your daily workflows. They can range from a simple time-tracking workspace to a detailed reporting overview.
Structure and default view
The first dashboard is a preconfigured Overview containing common widgets such as task lists, calendars, time statistics, and notifications.
You can add any number of personal dashboards and configure them independently.
Create a dashboard
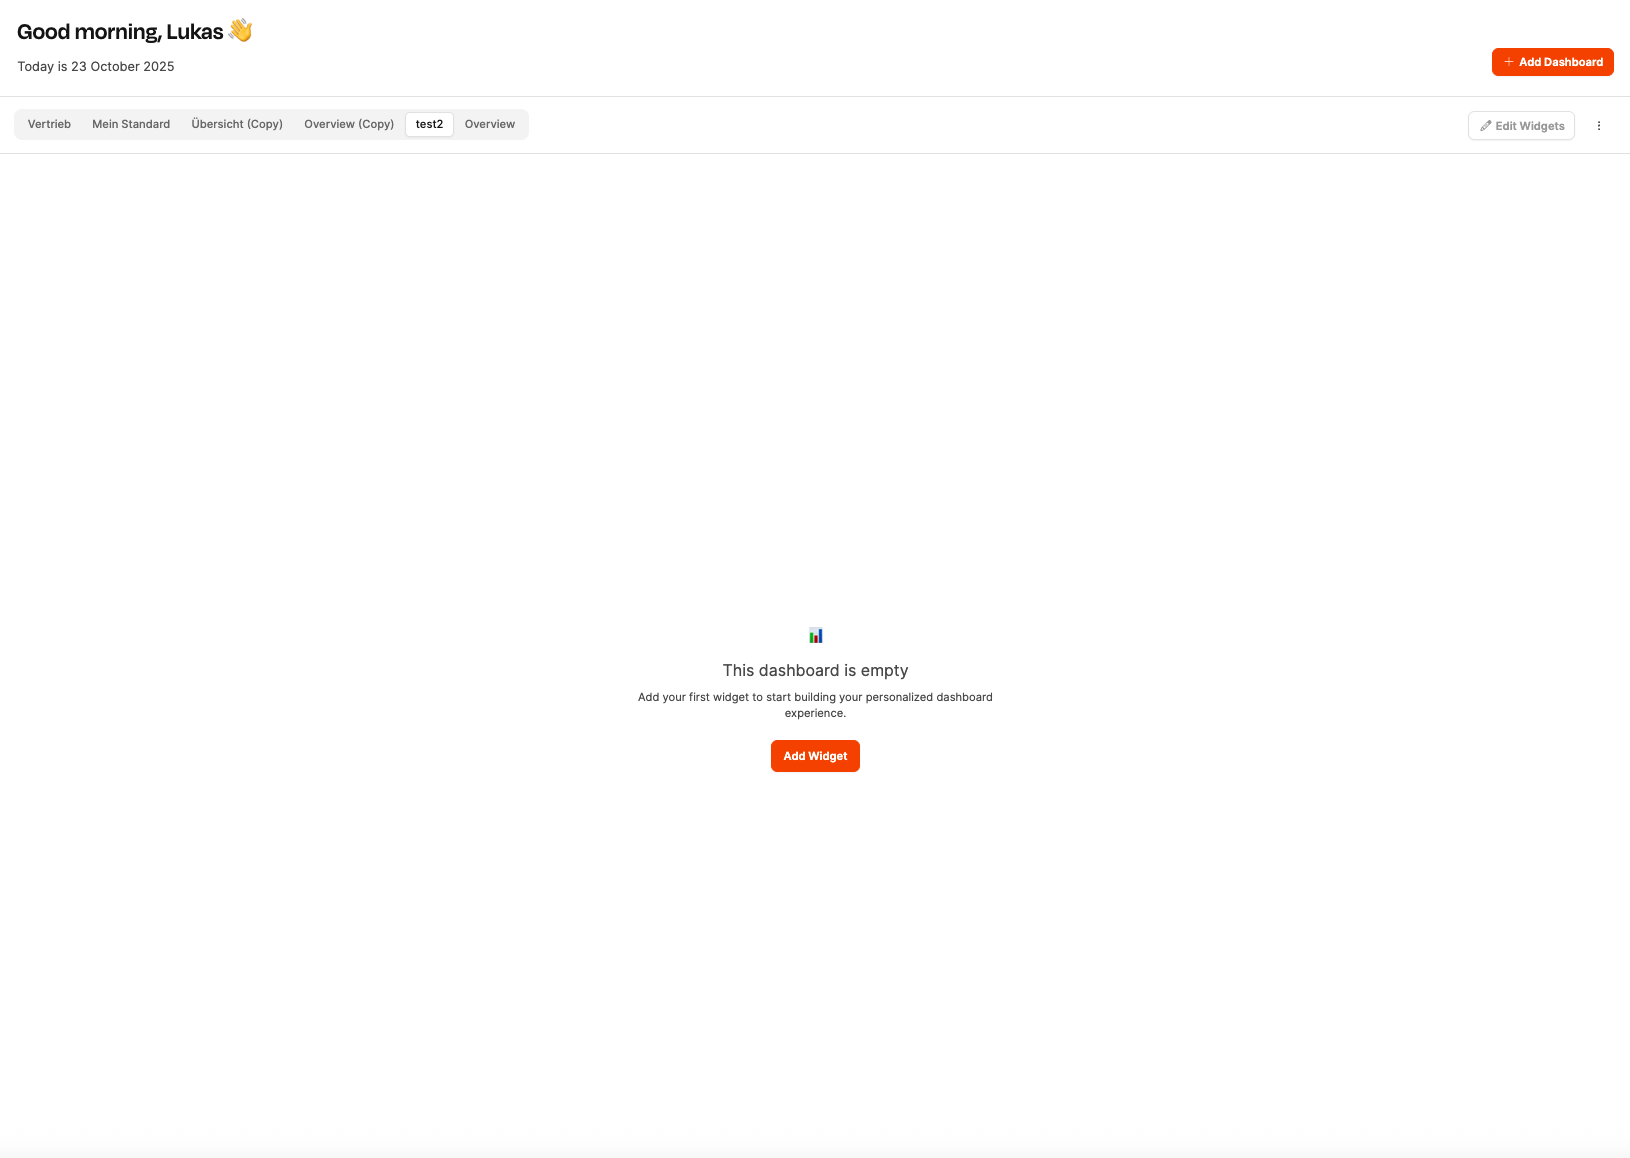
- Select Add Dashboard in the top-right corner.
- Enter a name.
- Select Save.
Leadtime creates an empty dashboard that you can fill with widgets.
Add widgets
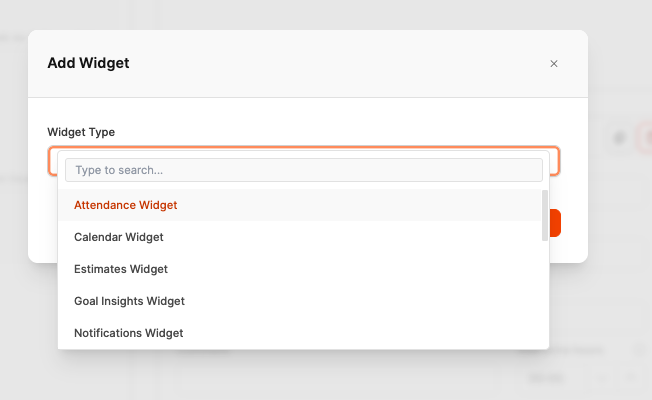
Widgets display information such as task lists and charts or provide tools such as time tracking.
- Select Add Widget.
- Choose a widget type.
- Configure its additional options, such as a data source or View.
- Select Add.
Layout and customization
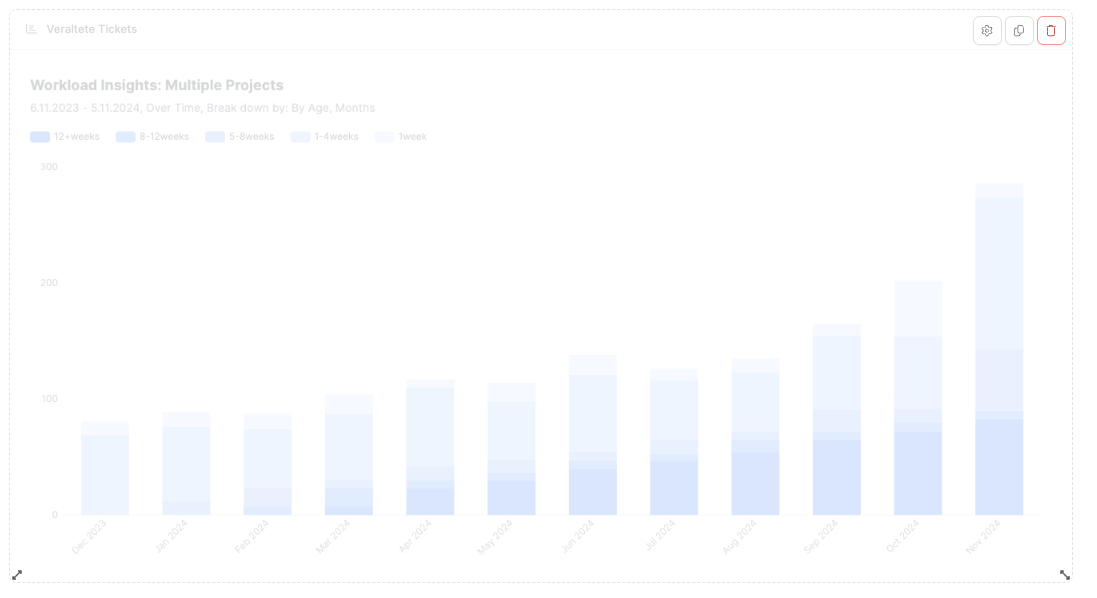
Dashboards use a flexible six-column layout. Resize each widget from one to six columns and set its height freely. Drag and drop widgets to rearrange them.
Resize arrows appear below a widget, with three controls above it:
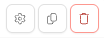
- ⚙️ Configure: Change settings such as the chart preset
- 📄 Duplicate: Create a copy
- 🗑️ Delete: Remove the widget
Select Compact to arrange the layout efficiently. Select Exit Edit Mode to return to the normal view.
Widget types
🕒 Attendance Widget
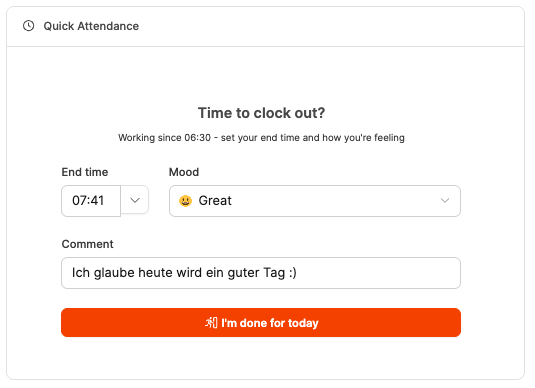
Clock in and out directly from the Dashboard. See your current working time, choose a mood emoji, and add a short comment.
It is often used with the Calendar or Time Tracker Widget. Learn more about attendance tracking.
📅 Calendar Widget
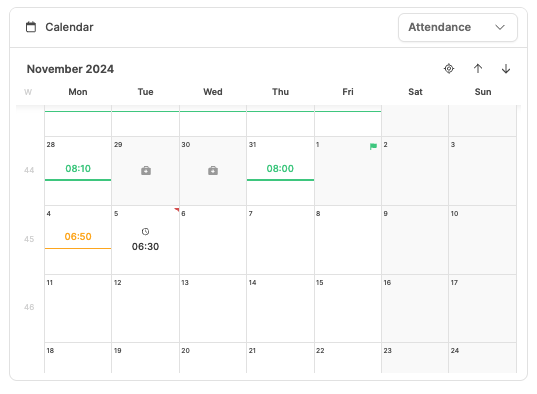
Displays a personal or project calendar. Choose the default mode:
- Attendance
- Mood tracking
- Time tracking
- Billable time
Use it to review workdays, absences, and planned entries. Learn more about the Time Tracker.
📋 Estimates Widget
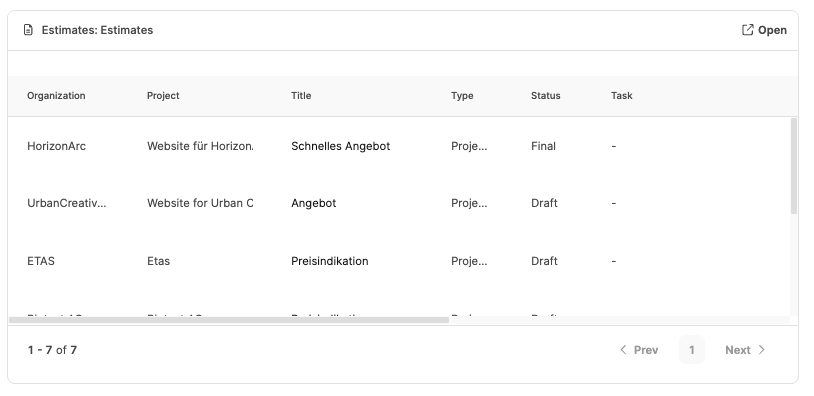
Access active estimates without leaving the Dashboard. Display saved list or Kanban views for project estimates in Draft, Waiting for Approval, or Final status and express quotes in Pending status.
Learn more about Estimates.
🎯 Goal Insights Widget
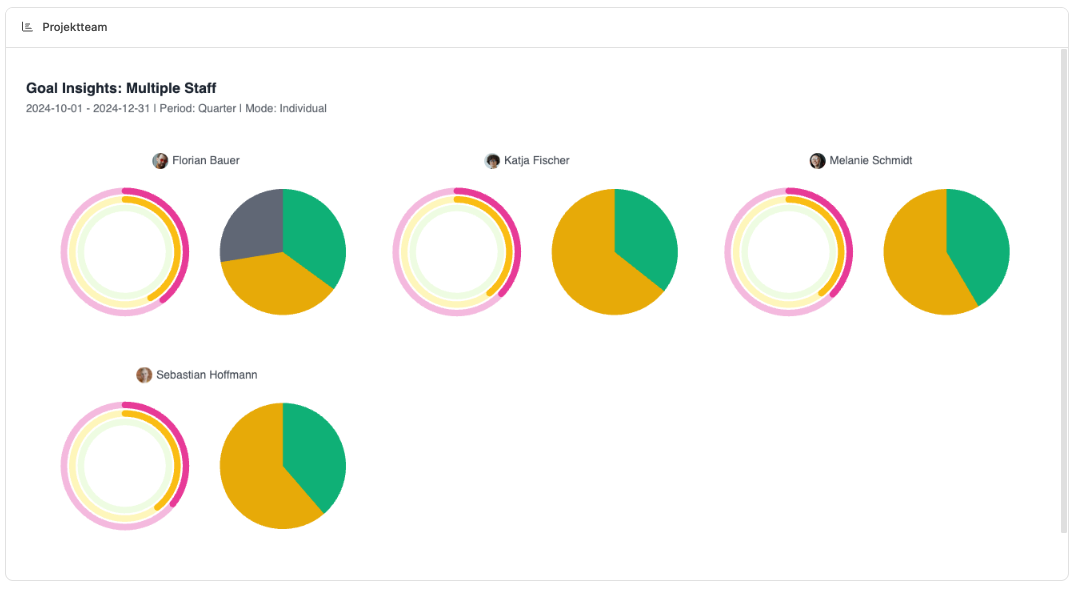
Displays saved Insights chart presets for objectives, KPIs, and progress, for example:
- Goal attainment by team or department
- Progress of active projects
- Planned versus recorded hours
This is useful for managers who need important metrics at a glance. See Goal Insights.
🔔 Notifications Widget
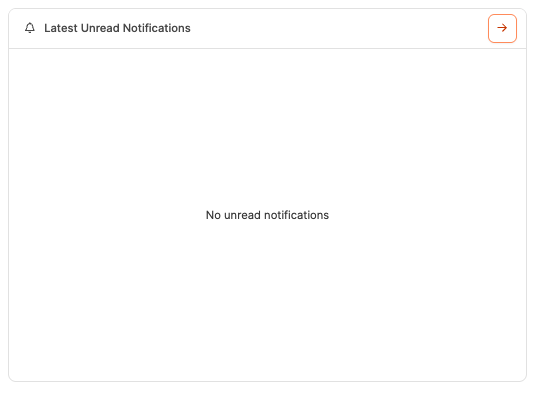
Shows the newest notifications. Configure it to display all notifications or only unread ones, keeping project, task, and comment updates visible.
Learn more about the messaging system.
🧩 Organizations Widget
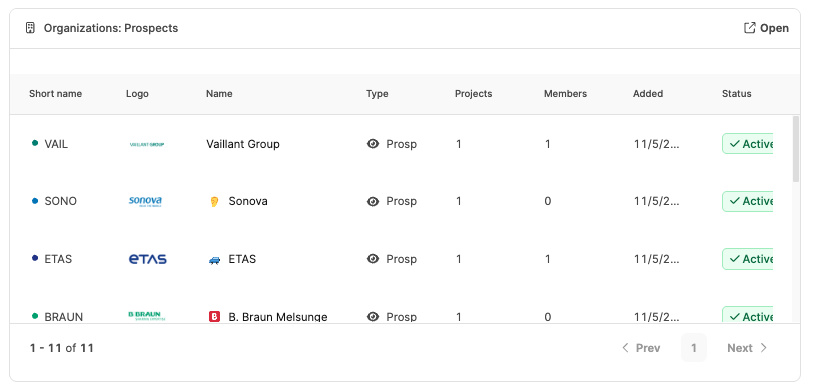
Embeds saved Organization Views for customers, suppliers, and partners. Examples include customers with open projects, active opportunities, and partners by region. The selected View determines whether the widget uses a list or Kanban layout.
Learn more about Organizations.
📊 Project Insights Widget
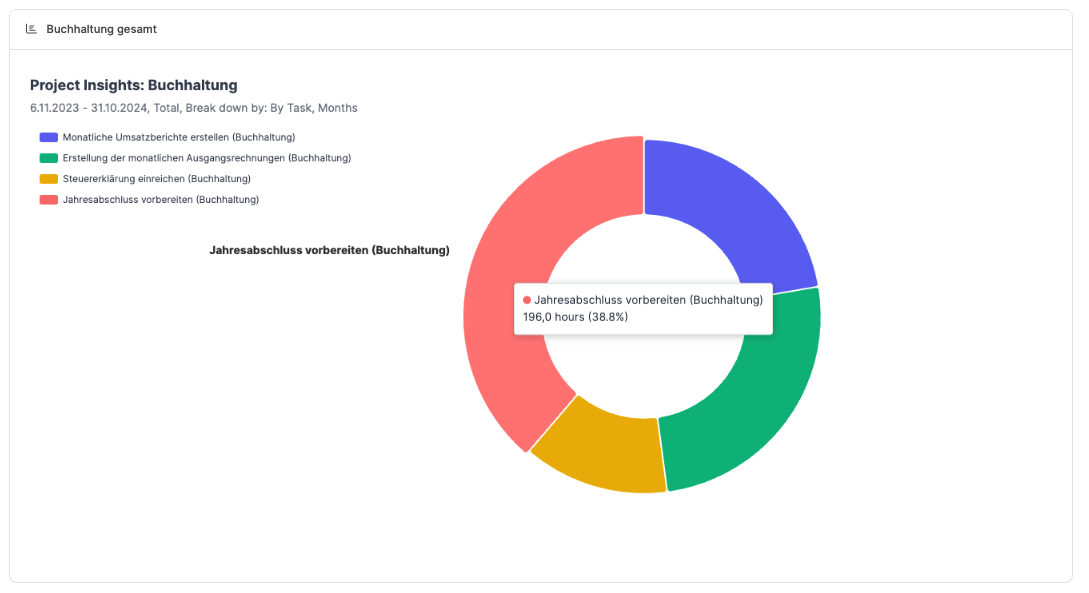
Visualizes project analytics such as:
- Project progress
- Budget usage
- Time variance
- Task status across projects
Connect it to a saved chart preset for recurring analysis. See Project Insights.
🗂️ Project Widget
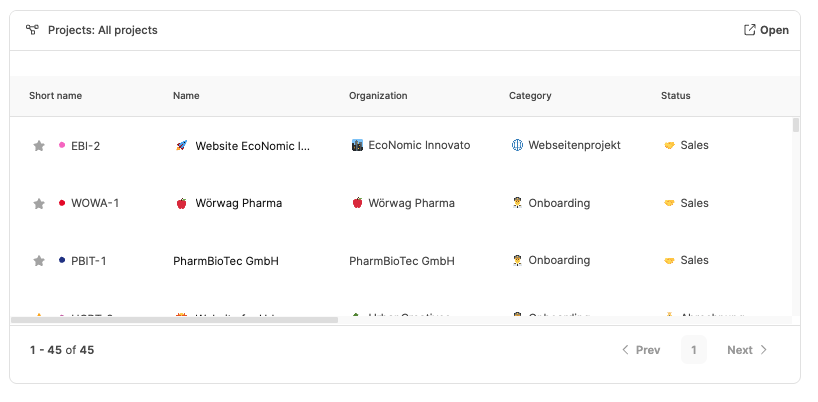
Shows active or completed projects in a list or Kanban View. Filter by internal projects, external projects, or opportunities and open project details directly.
Learn more about Projects.
🧱 Stack Widget
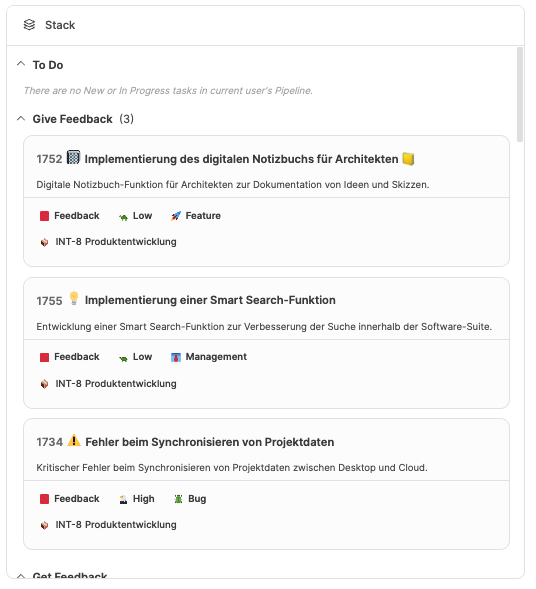
Shows your personal Stacks, a developer-style pipeline or task list. It helps teams organize work by priority or stages such as To Do, In Progress, and Done.
Learn more about Stacks.
👥 Staff Insights Widget
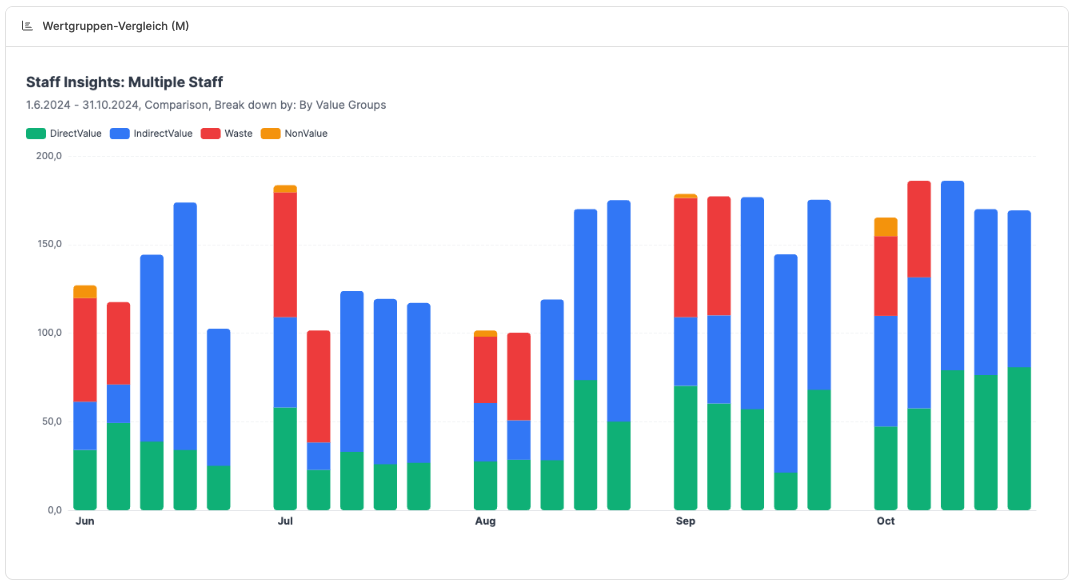
Displays workforce and team metrics, including:
- Utilization by team or employee
- Average working time
- Distribution of billable hours
- Attendance and activity statistics
Team leads can identify overload and free capacity quickly. See Staff Insights.
✅ Tasks Widget
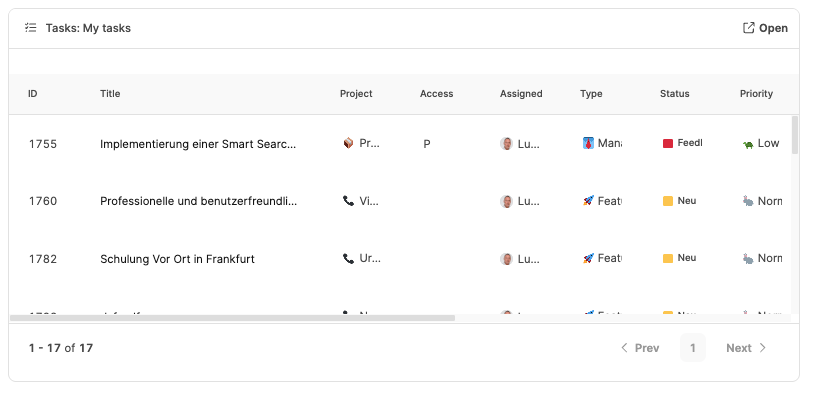
Shows your own or project-related tasks from the ticket system, including open, active, and completed work. Use it as a personal to-do list or a team task board.
Learn more about Project Tasks.
⏱️ Time Statistics Widget
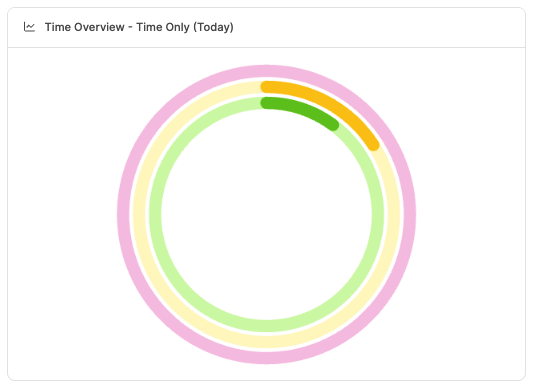
Compares attendance, recorded time, and billable time across a day, week, month, or quarter. This visualizes progress toward targets such as the billable share of planned working time.
See time-booking targets.
🕓 Time Tracker Widget
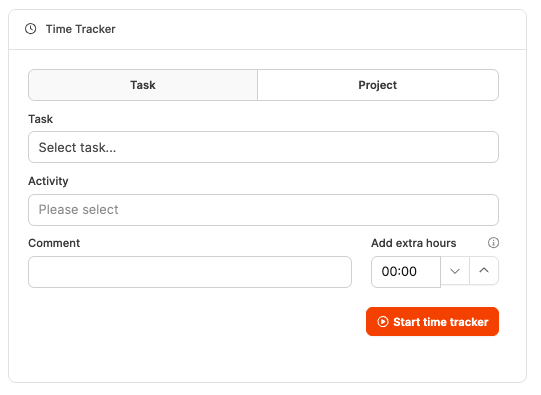
Record time directly from the Dashboard. Choose a task, activity, and project, add a comment, and start the timer. It is ideal for people who switch between tasks throughout the day.
See the Time Tracker.
💰 Turnover Insights Widget
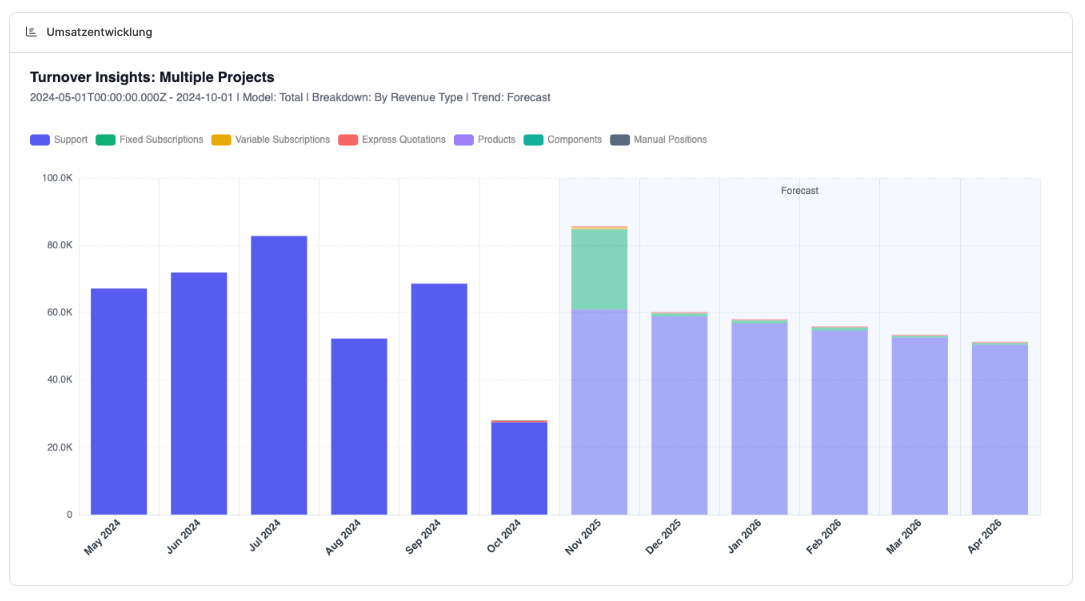
Displays revenue metrics such as revenue by customer, monthly trends, and planned versus realized revenue. Saved chart presets make it useful for management and controlling.
See Turnover Insights.
📈 Workload Insights Widget
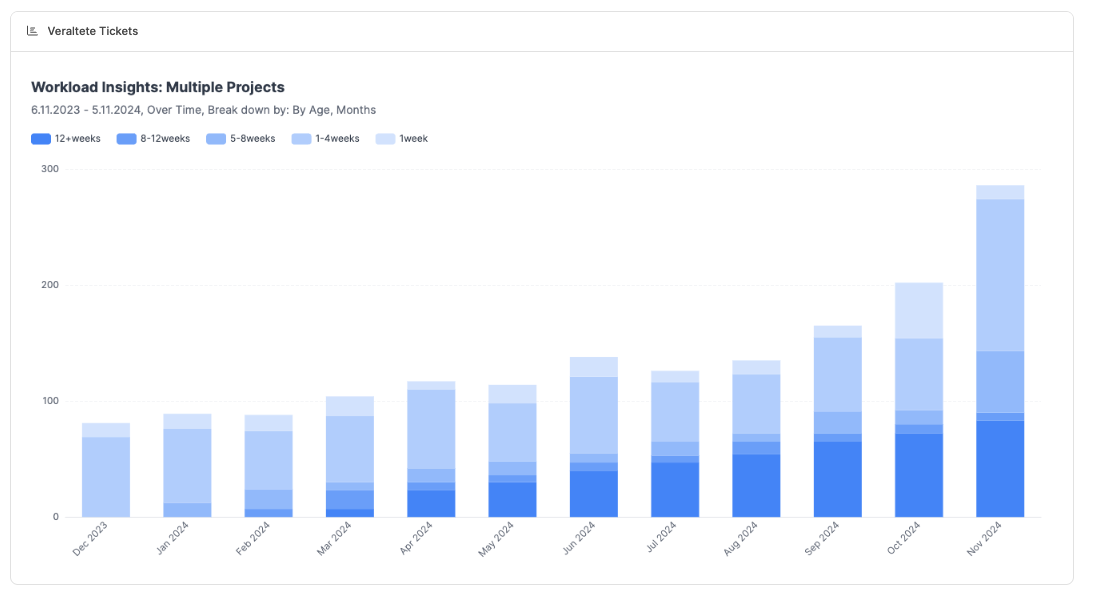
Visualizes utilization across teams and projects. Identify uneven work distribution, overbooked projects, and available capacity using live task and time-entry data.
See Workload Insights.