
Overview Tab
The project overview shows the status, effort, progress, and basic information of a project at a glance.
The project overview gives you a quick entry into a single project and shows all relevant basic info, status numbers, and time progress. It’s the first stop for project team members to get how progress, effort, and conditions are going. You’ll find this area in Leadtime under Projects → [Select Project] → Overview.
Everything about projects
How it works
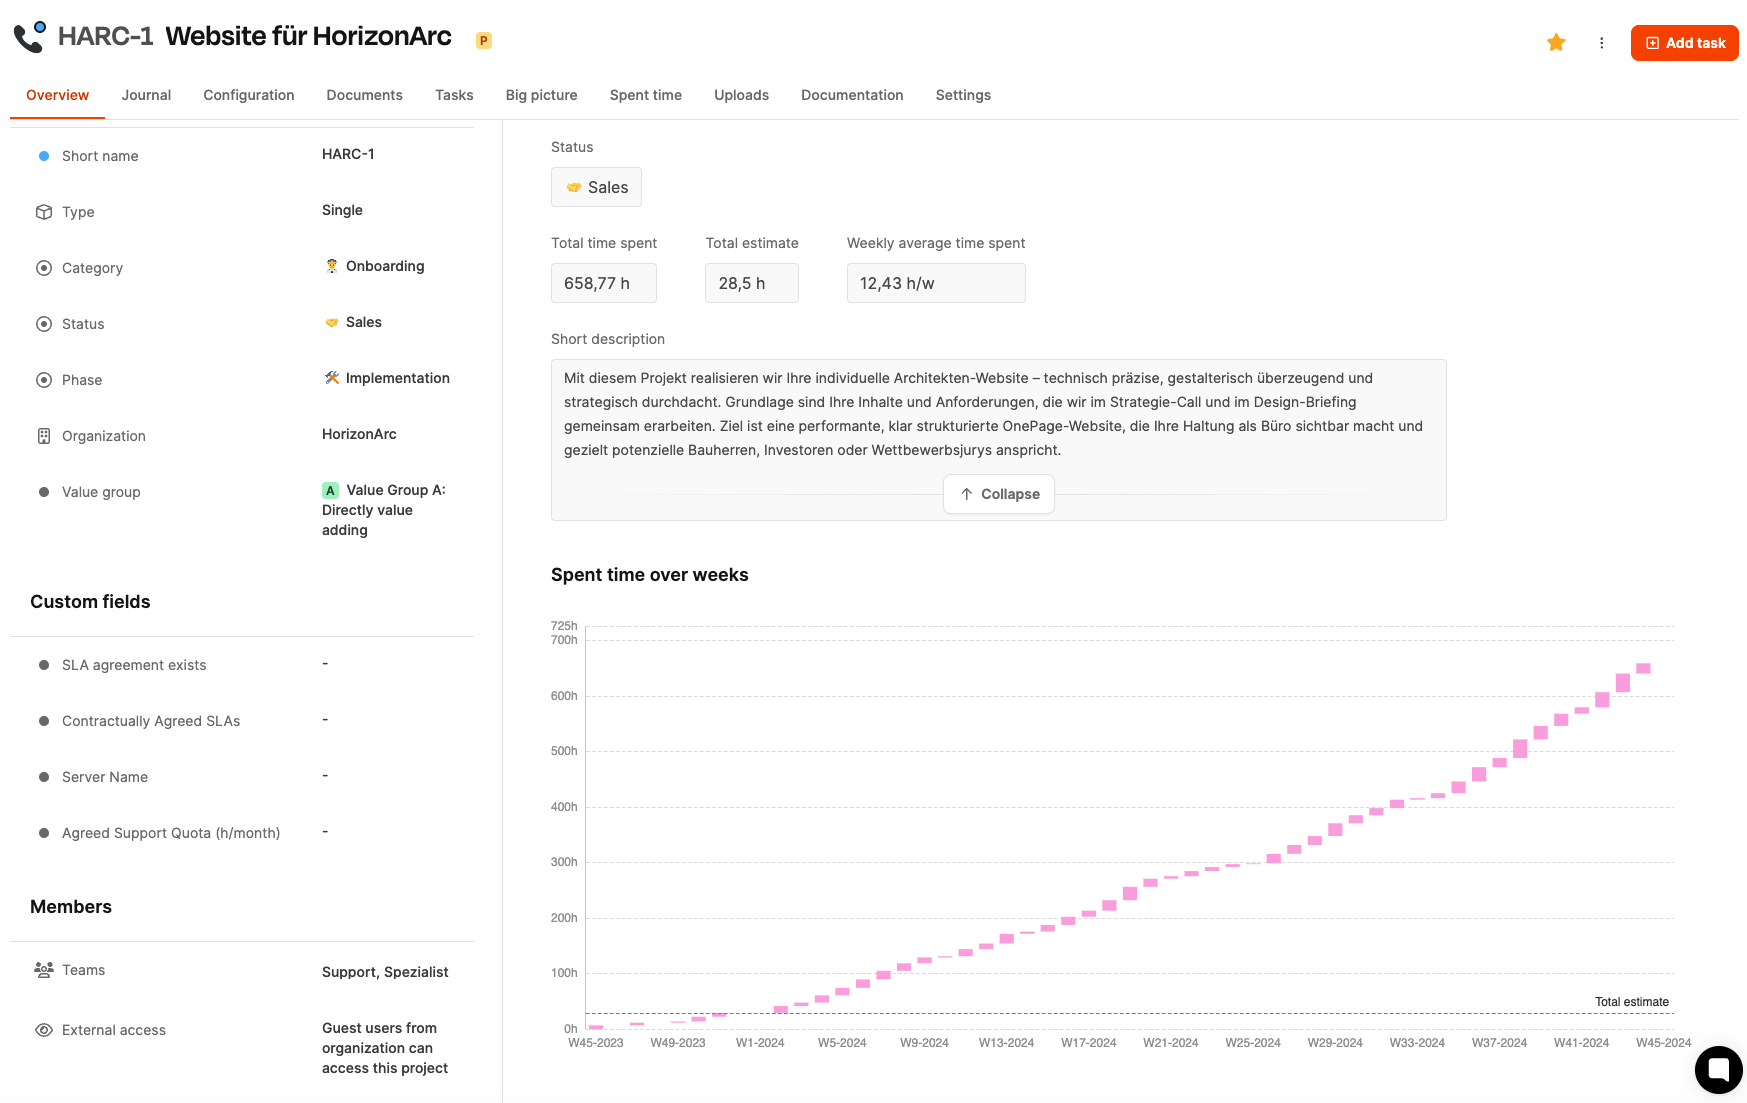
The page is built with two columns and has several info sections showing both operational and admin aspects of the project.
Left column: Basic info
Most of the fields here are managed through Projects – Settings – Basic settings.
Here you’ll see key metadata about the project:
- Short name System-generated identifier for unique identification.
- Type Classified as single project or ongoing project.
- Category Thematic classification (e.g. onboarding, support).
- Status Current project phase in the lifecycle (e.g. sales, implementation).
- Phase Detailed status showing the internal process situation.
- Organization Ordering or internal organization.
- Value group Value creation rating according to internal classification.
These include project-specific, custom fields like:
- SLA agreement
- Contract details
- Server reference
- Hourly quotas
These fields can vary by project.
Members area
- Teams Shows which roles have access (e.g. support, specialists).
- External access Specifies whether guests from the customer’s organization can get access.
Right column: Project status & key figures
Core performance values for the project:
- Status (Badge) Shows the current stage (e.g. sales, implementation).
- Total time Sum of all recorded hours.
- Total estimate Planned value, how many hours were originally estimated.
- Average weekly time Average amount of time spent over the last few weeks.
- Short description Free text to describe and define the project’s goal.
Visualization: Time spent over weeks
Below the key figures there’s a graphical analysis:
- Shows the cumulative time spent per calendar week.
- Lets you analyze trends over the whole period.
- Compares actual time with the overall estimate.
- Helps spot budget issues early.
The timeline can run over months or years, and gives a realistic view of long-term project progress.
Interactions and visible UI elements
- Change status Can be set via a dropdown (depends on permissions).
- Expand/collapse short description Helps keep things clear when the text gets lengthy.
- Custom fields Editable via the Settings section in the project.
- Timechart Responds to time entries made later and updates itself automatically.