
Workload Insights
Shows current or temporal developments of open tickets. Helps to identify bottlenecks and overloads at an early stage and to manage projects efficiently.
With Workload Insights, you analyze how the number of open tickets in your projects is developing – either right now or over longer periods. The aim is to make workloads transparent, spot trends early and avoid overloads. This view is especially helpful for support and project teams to identify bottlenecks and specifically manage the processing of open tasks.
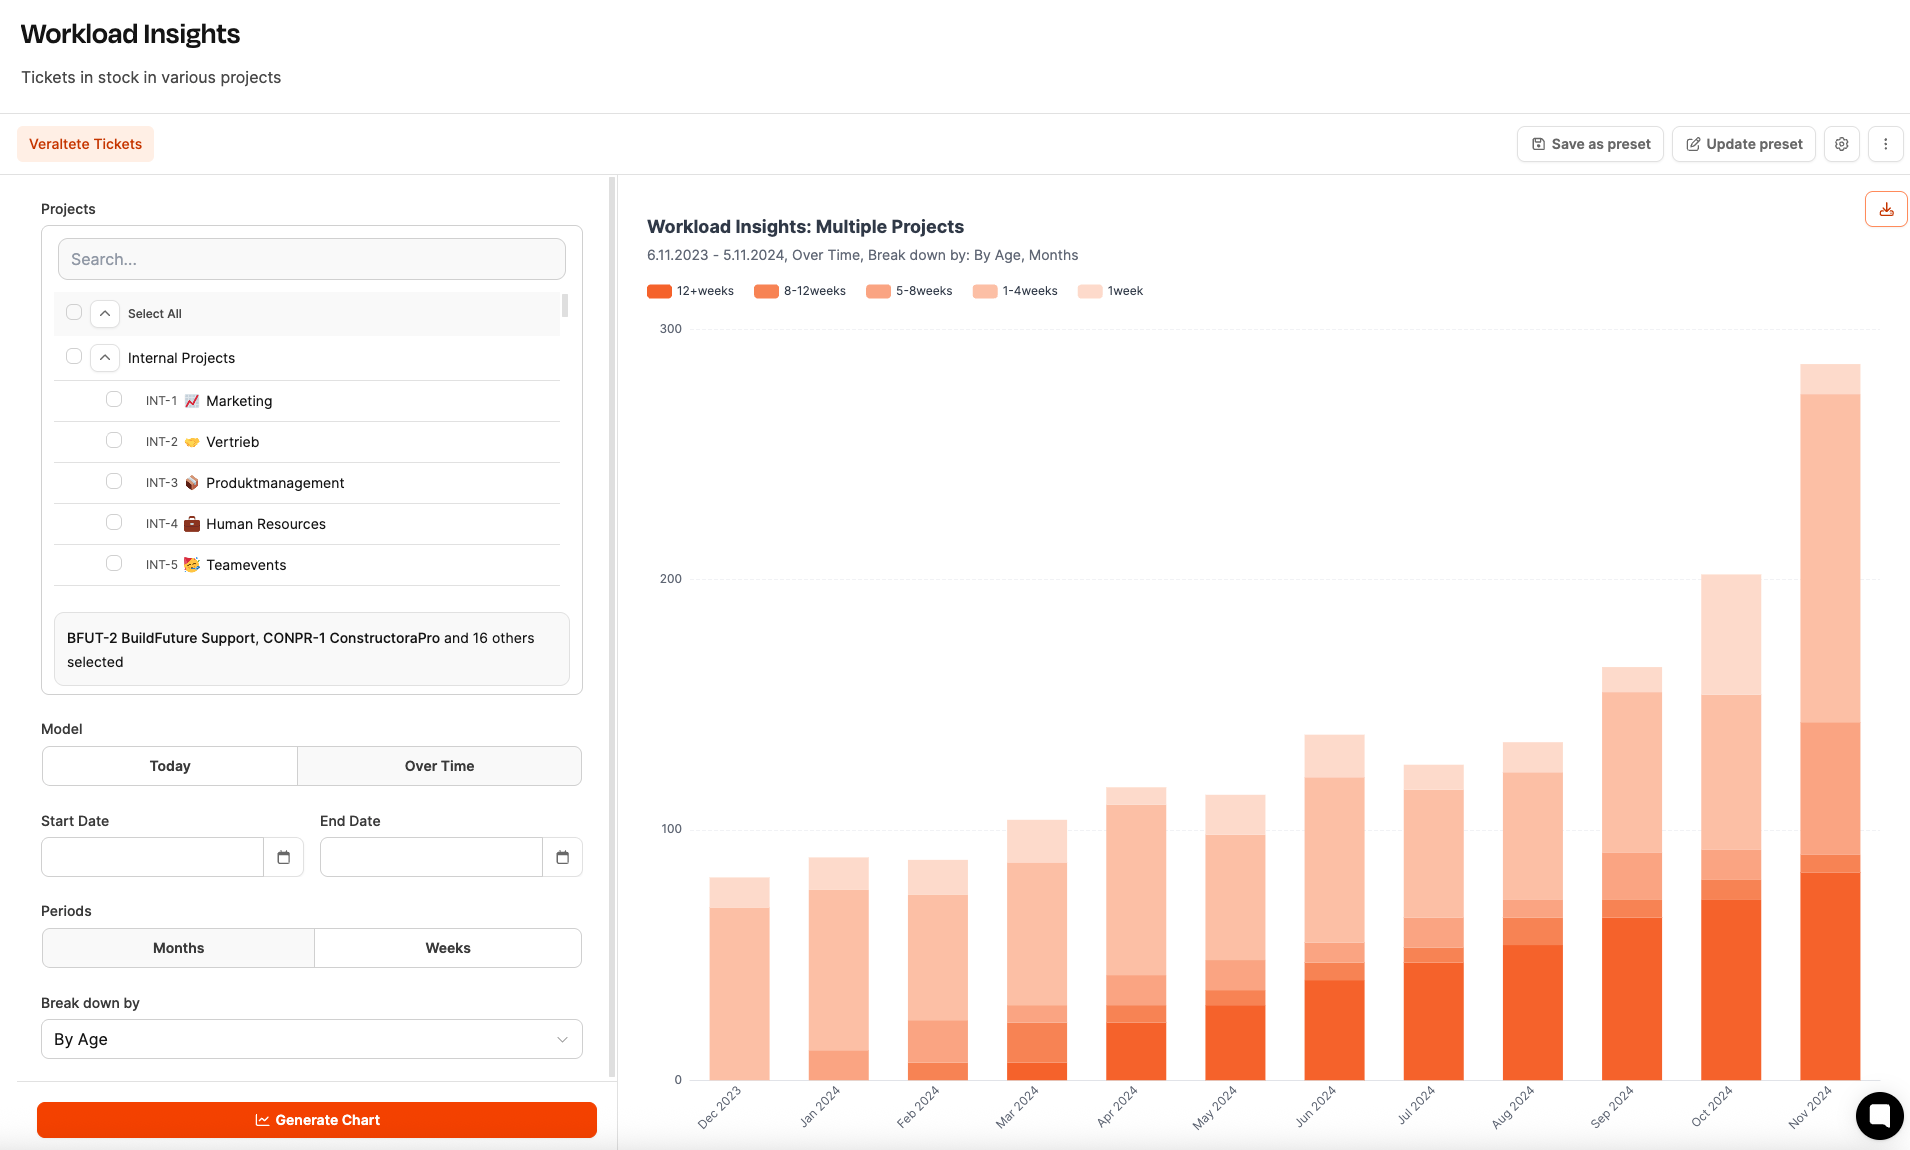
With Workload Insights, you can see at a glance whether your team is keeping up with the current volume of tasks. You can tell which projects are especially busy and where tasks are piling up. The evaluation helps you manage resources in a targeted way, adjust priorities and ensure a balanced distribution of work within the team.
Structure
The page is divided into two parts:
- Left column: Configuration of the analysis (projects, periods, breakdown)
- Right column: Visualization of the results in diagrams
Configuration options
Project selection
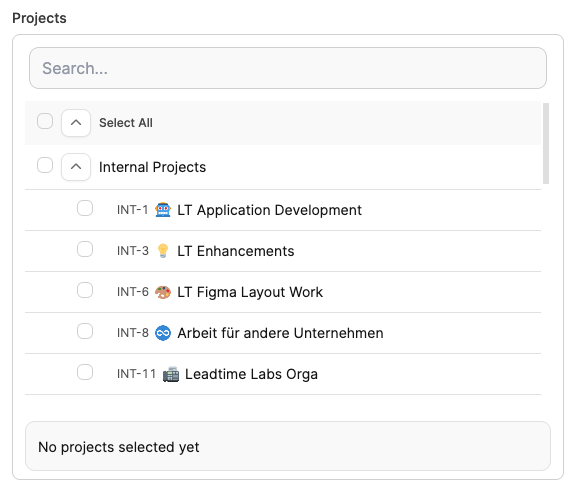
- Select one or more projects (internal or external).
- Optionally, you can use the search field to filter specifically by project name.
Model

- Today: Shows the current status of open tickets in the selected projects.
- Over time: Shows how the stock of open tickets changes over weeks or months.
Time period
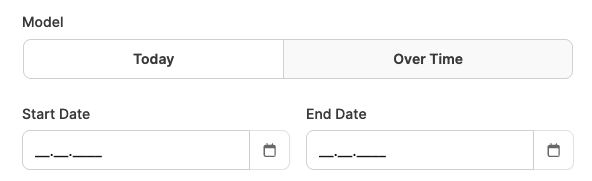
- Active with the Over time model.
- Freely selectable start and end dates.
- Optional display by weeks or months.
Breakdown by

Determine how the data should be grouped:
- Project: Compare the ticket stock between projects.
- Status: Display by processing phase (e.g. New, In Progress, Feedback).
- Task type: Differentiation between Feature, Bug, Idea, Management, etc.
- Age: Grouping by ticket duration (e.g. “under 1 week”, “4–8 weeks”, “over 12 weeks”).
Chart types
“Today” model
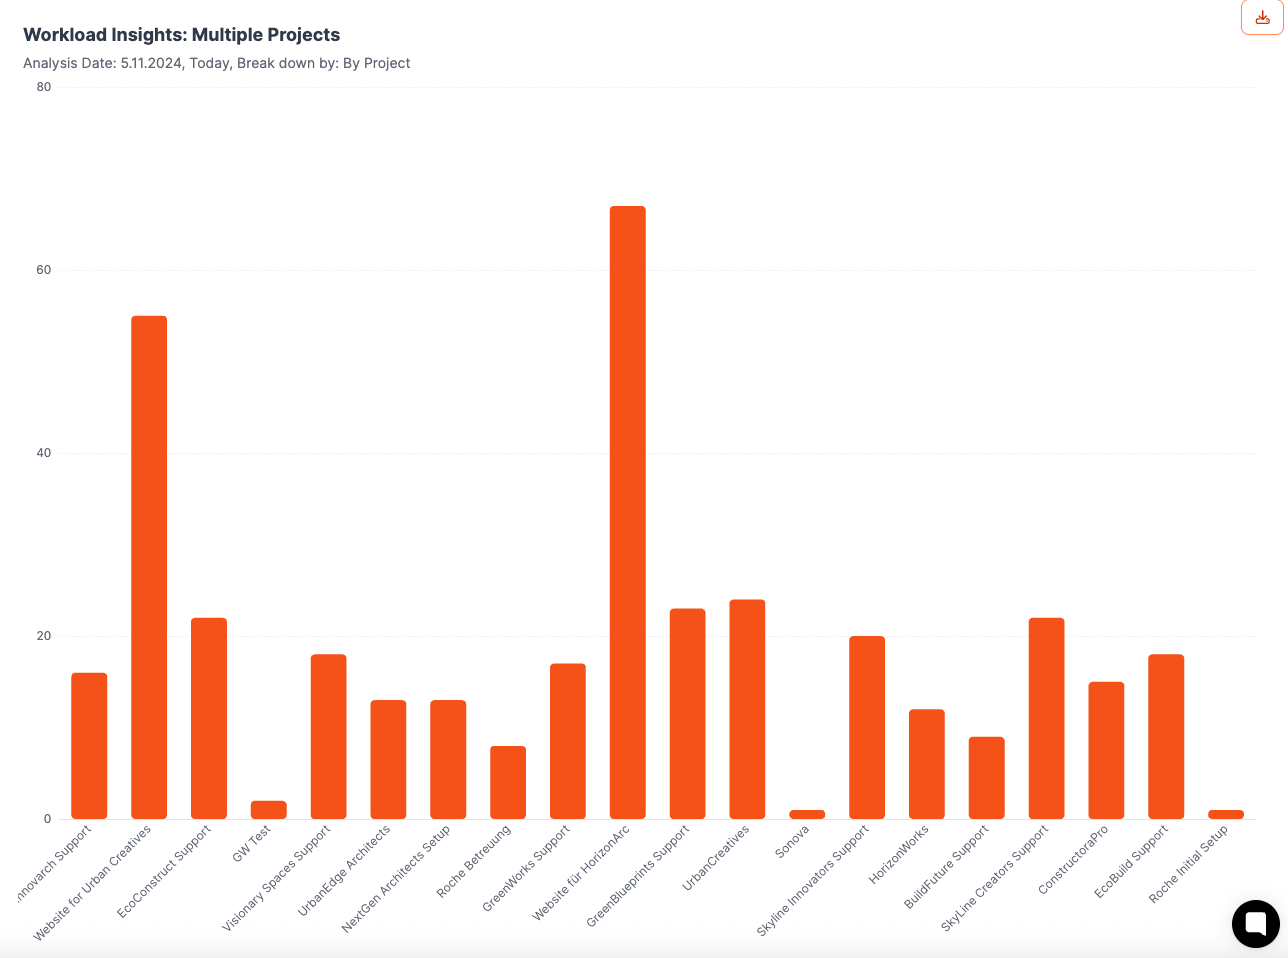
Shows the current ticket stock as a bar chart, grouped by:
- Project
- Status
- Task type
This view is suitable for seeing at a glance where most of the work currently falls.
“Over time” model
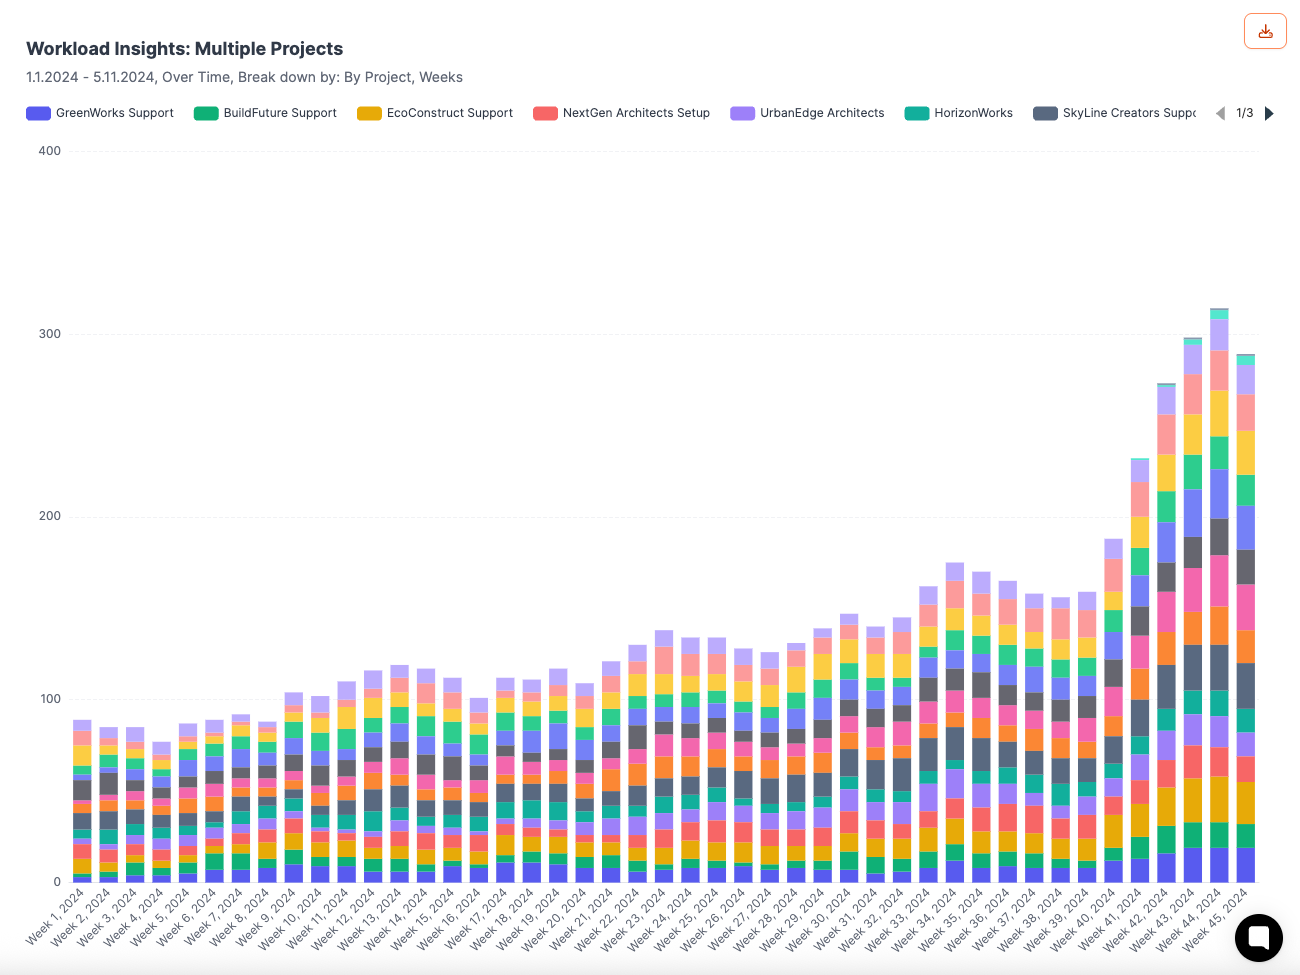
Shows the development of open tickets over weeks or months as a stacked bar chart.
- Illustrates trends: increase, decrease or stagnation of tasks.
- Makes backlogs or overaged tickets visible.
- Categories: status, task type or age.
Application examples
| Question | Setting options |
|---|---|
| How many tickets are currently open, and in which projects? | - Select projects - Model: Today - Breakdown by project |
| How has the workload developed over the last few months? | - Select projects - Model: Over time - Set start date - Periods: weeks or months - Breakdown by task type |
| How many tasks are overaged, and is this share growing? | - Select projects - Model: Over time - Set start date - Periods: weeks or months - Breakdown by age |
The saved diagrams can be shown on the Dashboard.