
Big Picture
The Big Picture visualizes tasks by type, status and priority, enabling quick, clear project planning with minimal coordination effort.
The Big Picture view in Leadtime ERP is available for every project and helps you keep a visual overview of the tasks ahead. To open a project’s Big Picture view, select the project you want under the “Projects” menu item and choose “Big Picture” in the tab display.
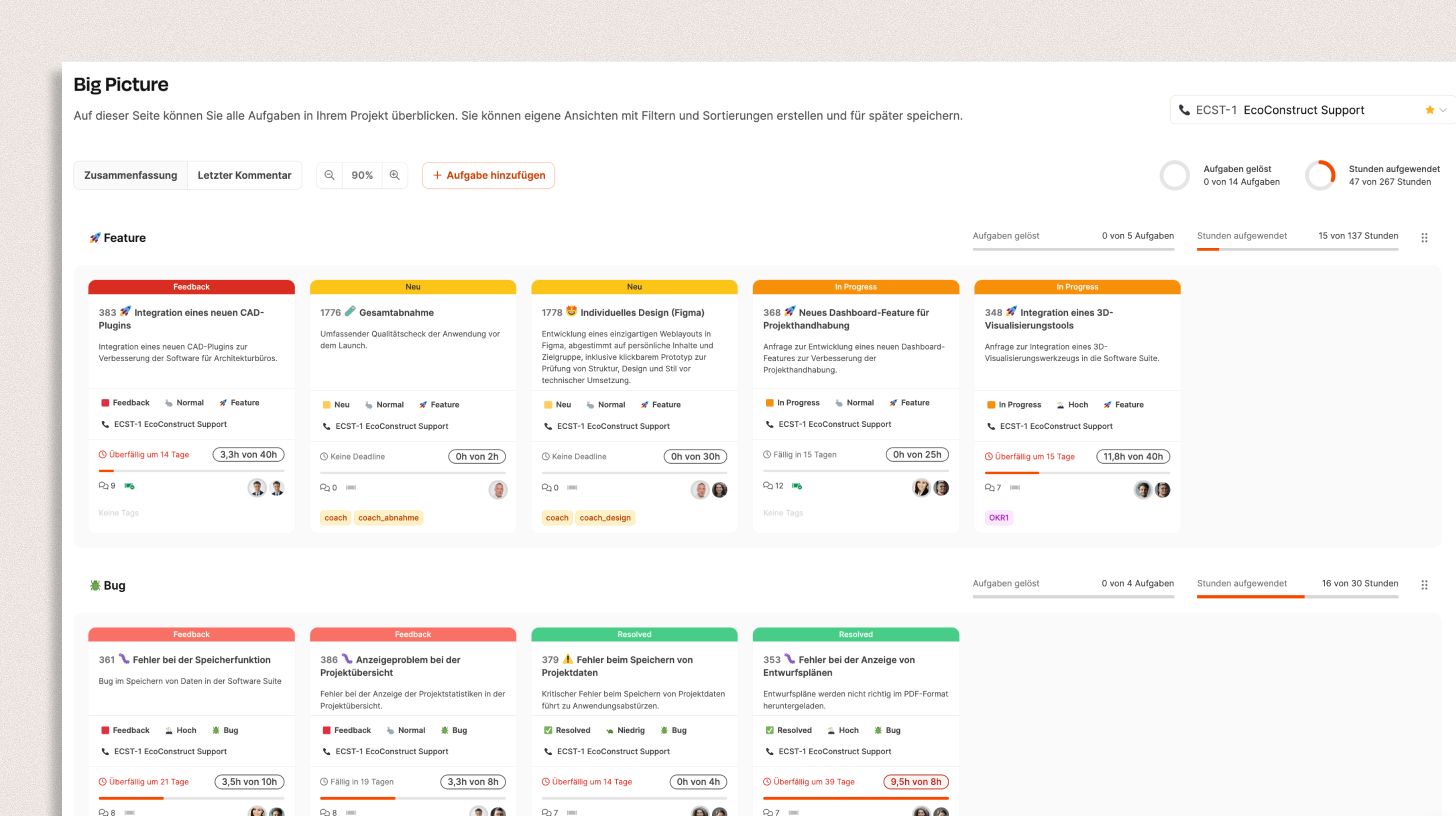
You can also reach the Big Picture view via the Planning → Big Picture menu item. Here you can switch projects using a dropdown in the header area to view the Big Picture of different projects.
Big Picture shows the tickets of a project. About the ticket system:
Projects – Tasks tab (ticket system)
How it works
The Big Picture shows all of a project’s tasks as cards, arranged in horizontal rows grouped by task type (e.g. Feature, Bug, Management).
Each card represents a ticket and contains all the important information in compact form. The tasks in a row can be prioritized from left to right — the further left, the higher the priority.
The Big Picture is fully interactive.
-
Drag & drop
Tasks can be moved within a row to adjust priorities.
Cards further to the left are considered more important or more urgent.
-
Horizontal scrolling
Long rows can be scrolled horizontally.
-
Open ticket
Clicking a card opens the detail view with all information, comments and history.
-
Add new task
Using the “+ Add Task” button at the top right, you can create a new task directly in the current project.
Big Picture use scenarios
Prioritizing customer requests
In practice, customers often submit many requests that vary in urgency. For example, a customer might submit several feature requests and bug reports at the same time. This is where Big Picture comes in, presenting the requests in a structured way:
Categorization by task type: Tasks can be sorted into categories such as “Feature” or “Bug”, so the urgency of each type is quickly recognizable.
Visual sorting by priority: The view allows an arrangement from left to right. Tasks on the left have a higher priority than those further to the right. This makes communication easier, because the customer can immediately see which tasks are in the foreground and make adjustments if needed.
An example: In a meeting, a customer decides that a certain feature is their highest priority, while a bug report is less urgent. The account manager can adjust this in the Big Picture right away and set the order so that the most important tasks stand out clearly. This creates a clear, shared view of priorities, and the customer feels actively involved in the planning.
Covering for an absence
In everyday company life, it often happens that an account manager is unexpectedly unavailable, whether due to illness or vacation. If a colleague or supervisor has to take over looking after the customer, going through each ticket individually would be tedious and time-consuming. Here the Big Picture offers a decisive advantage:
An overview in seconds: The person covering can immediately see which tasks are especially in focus and which are less urgent.
Fast flow of information: Big Picture shows the current priorities and status of the tasks in compact form. This lets the stand-in respond quickly to customer inquiries and give well-founded information.
Structure of the Big Picture
The Big Picture consists of a header with control options and the rows of tasks arranged below it.
Control bar

At the top there are several options for adjusting the display:
-
Summary / Last comment
Radio buttons let you choose whether the cards show the ticket summary or the last comment.
- Summary: shows the short description of each task.
- Last comment: shows the last post including its author, to quickly grasp the state of the discussion.
-
Zoom control (50–150%)
The view can be scaled using the magnifying glass icon. This lets you keep an overview with many tickets or focus on details.
-
Project switch & filters
The displayed project can be switched using the dropdown at the top right. Filters for status, priority or users can be saved and called up again later.
About the elements of a ticket Editing tasks
Progress rings

Two circular bars show:
- the share of completed tasks relative to the total,
- the comparison of booked hours to planned hours.
Row structure
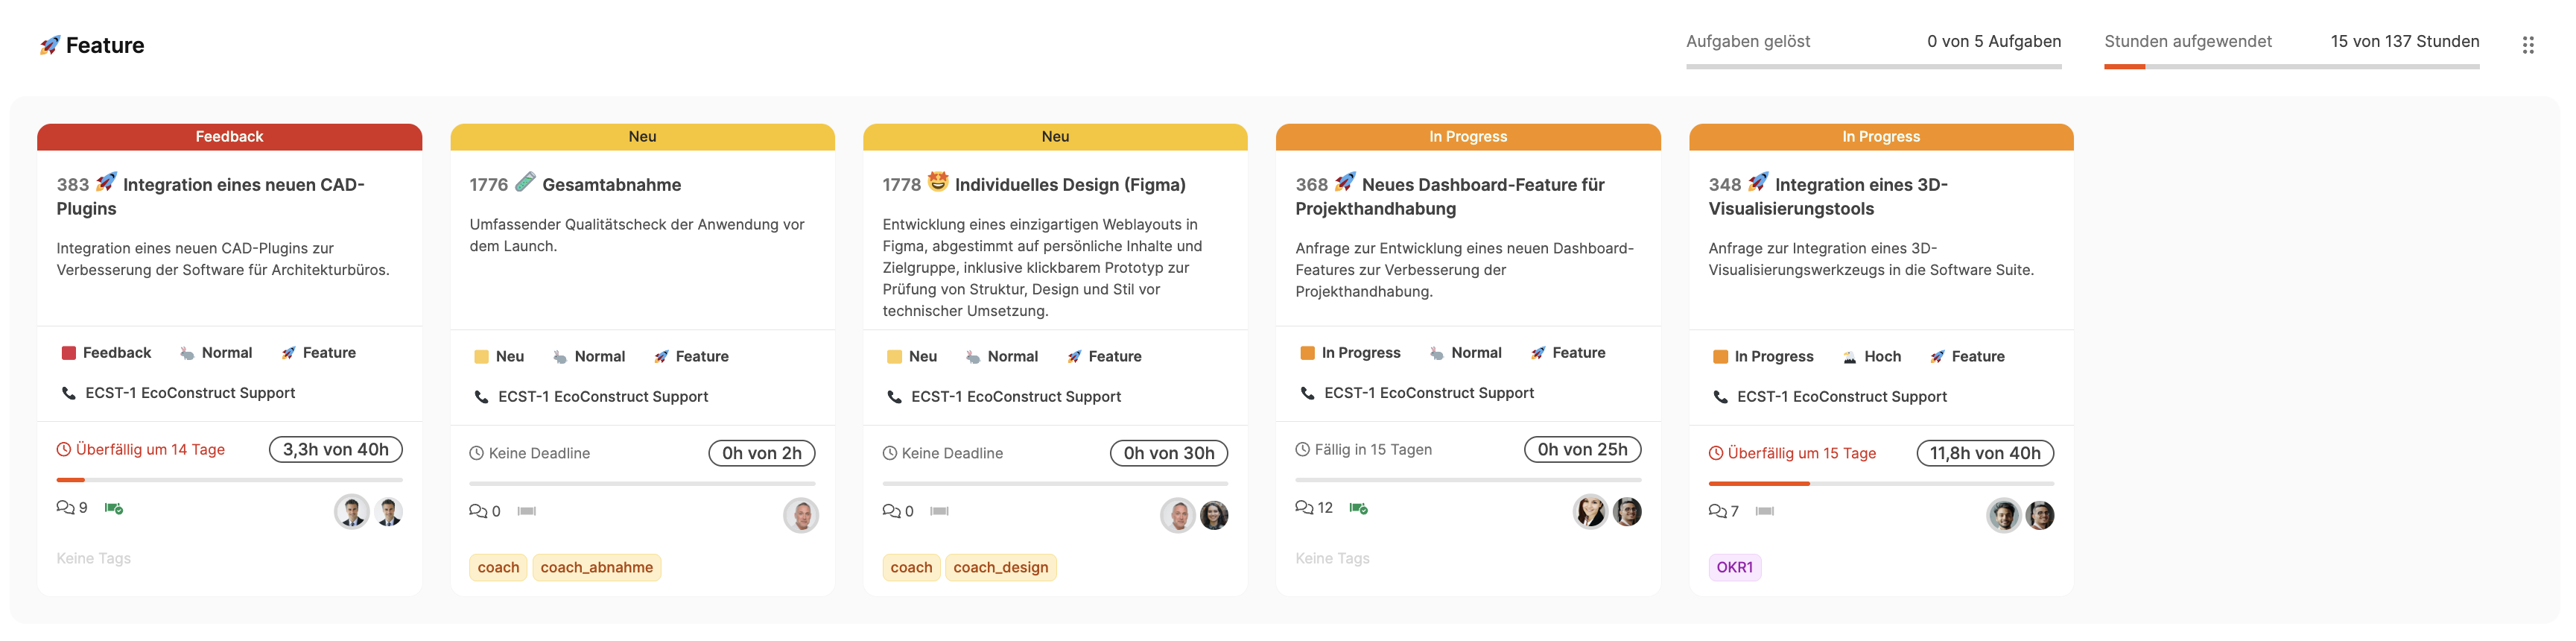
Each horizontal row in the Big Picture represents one task type, such as Feature, Bug or Management.
Within the row, tasks are presented visually as cards and sorted from left to right by importance.
-
Change order:
Rows can be rearranged using drag & drop to change the order of task types.
-
Progress bar:
Below each section, a bar shows how many tasks have been completed and how much time has been used compared to the estimate.
Elements on the cards
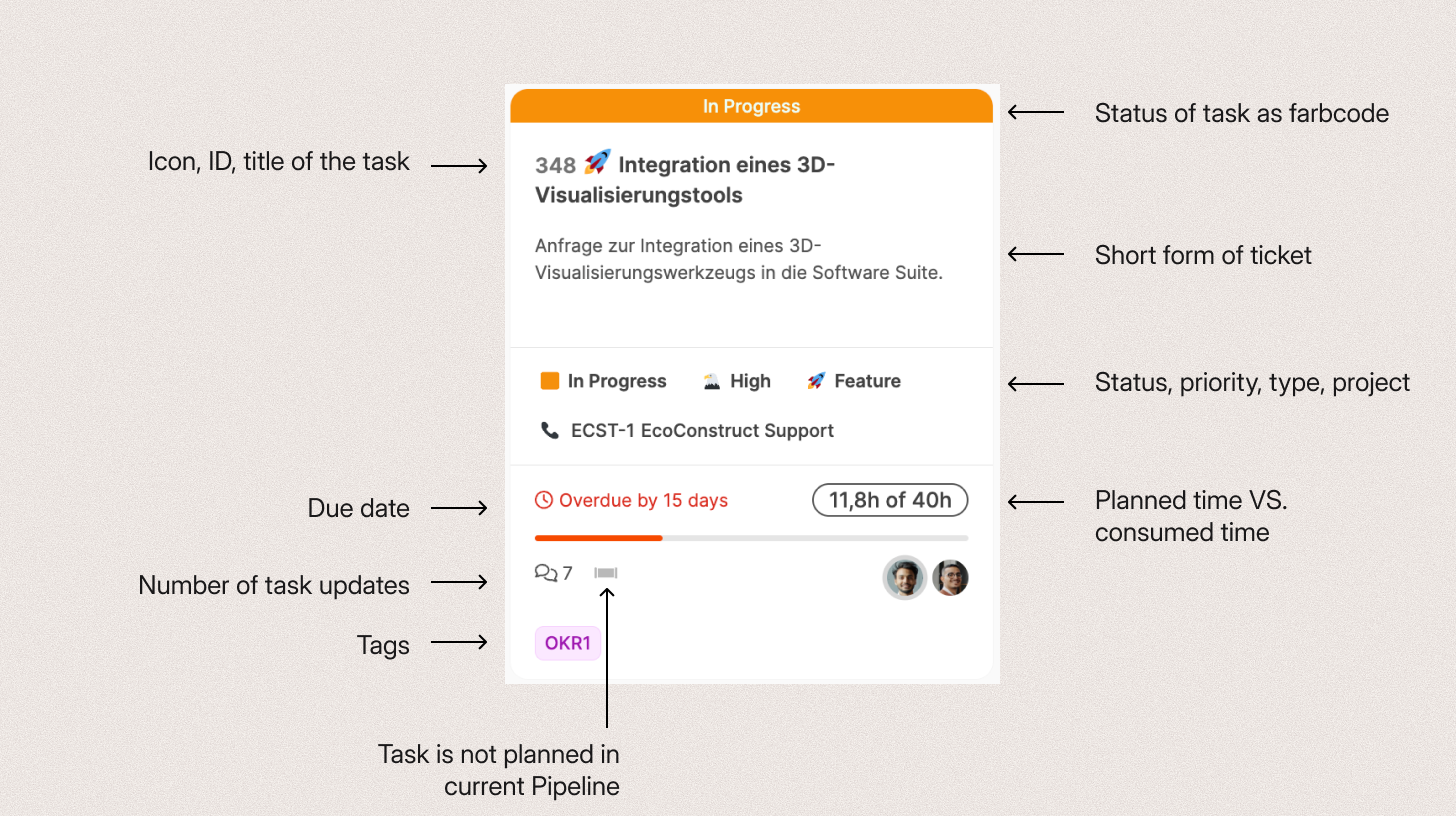
Each card in the Big Picture represents a single task (ticket).
The display compactly summarizes all the key information on status, effort, communication and participants.
-
Status bar (color bar at the top)
Shows the current task status as a color code:
- yellow_circle New
- orange_circle In Progress
- red_square Feedback
- green_circle Resolved
- white_circle Backlog
-
Title line
Contains the ticket ID, a matching icon and the title of the task.
-
Short description
Shows a concise description or — depending on the setting — the last comment.
-
Details
Lists status, priority, task type and the associated project.
-
Time & due date
Compares planned and consumed hours (e.g. “11.8 h / 40 h”)
and, if needed, shows a deadline warning (“Overdue by 15 days”).
-
Communication & pipeline status
- Comment icon with the number of posts
- Pipeline icon: shows whether the task is included in the current planning
-
Tags
Short keywords, e.g. OKR, sprint or phase
People involved
Small avatars show the key participants:
- right: the person currently responsible
- left: stakeholders or project management
About the elements of a ticket Editing tasks