
Sales Insights
Sales Insights is the central analysis tool for evaluating, structuring and forecasting your sales.
With Sales Insights (Turnover Insights) you analyze the composition and development of your revenue structure. You can see where sales come from, how they develop over time and which projects contribute the most.
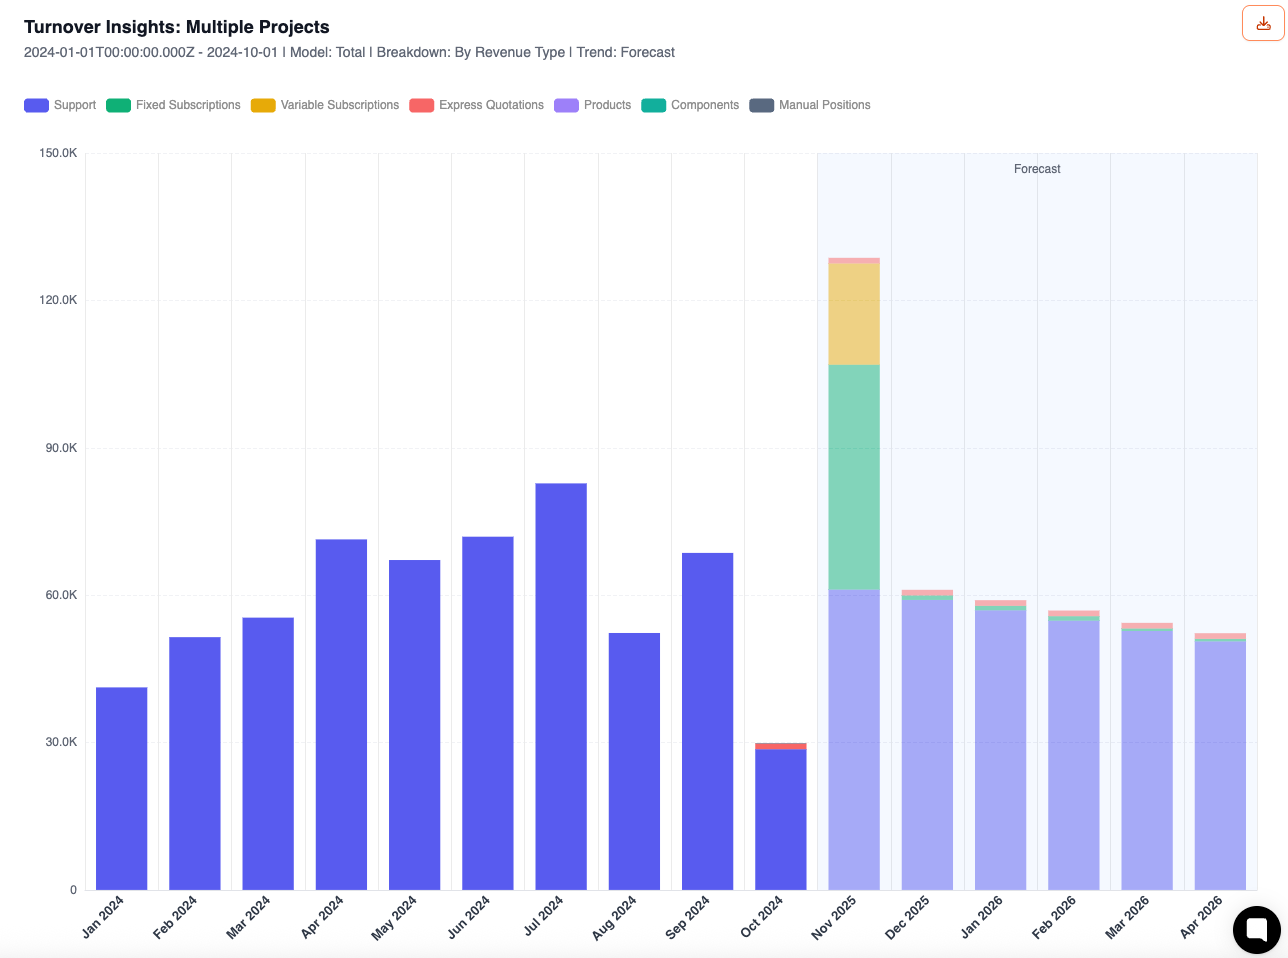
The analysis can be carried out for individual projects as well as across projects. This lets you examine the revenue distribution in detail – for example by revenue type, project or time period. The module supports you with planning, controlling and forecasting and helps you spot trends early.
This area uses the data from the Billing section.
Page layout
- Left column: Configuration (projects, period, model, breakdown, forecast)
- Right column: Result chart with legend, tooltip, export and saved presets
Configuration (left column)
Select projects
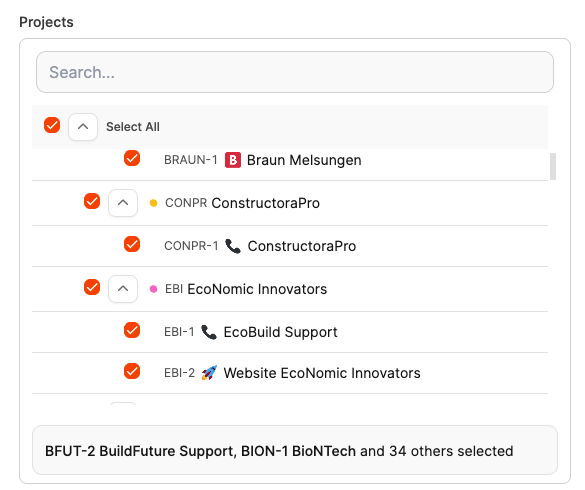
- Choose one or more internal or external projects.
- At the top you’ll find the Select All checkbox, which activates all external projects at once.
Set time period

- Define a start date (required) and, optionally, an end date.
- If you don’t set an end date, the current date is used as the end time.
Choose model

- Comparison: Displays multiple projects side by side – for example ten projects per month in a direct comparison.
- Total: Aggregates and stacks the revenue of all selected projects into total bars.
Break down by

- By Project: Shows how much each project contributes to revenue.
- By Revenue Type: Splits revenue by type (support, subscriptions, products, etc.).
Include Trend

- Off: Actual values only.
- On: Activates the forecast view – visible as an additional block on the right side of the chart.
How the trend calculation works:
The trend line is based on historical data and automatically takes into account:
- subscription contracts (e.g. ongoing monthly subscriptions with a fixed fee),
- average support revenue over the last few months,
- and planned project deadlines together with their expected revenue.
This produces a graphical projection of future revenue development based on your history so far.
Generate Chart
Creates or updates the chart with the selected settings.
Chart (right column)
Presentation
- Bar chart per month or per selected period.
- Stacked or side by side, depending on the model (Total or Comparison).
- The tooltip shows the monthly value, breakdown and total.
Terms & revenue types (legend)
In the charts, the different revenue types are shown as colored series:
- Support – billed support services
- Fixed Subscriptions – fixed subscription fees
- Variable Subscriptions – consumption-based subscription fees
- Express Quotations – express quotes created directly from tickets
- Products – product sales from the catalog
- Components – revenue from project components
- Manual Positions – manually recorded revenue items
Interactions
- Hover: Shows details about revenue types and totals in the tooltip.
- Click on the legend: Shows or hides individual series.
- Scroll & Zoom: Longer time periods can be browsed interactively.
Presets & Export

- Save as preset: Save the current view to reuse it later – for example on the dashboard.
- Update preset: Overwrite an existing preset.
- Export: Download the data as a file (e.g. CSV or Excel).
The saved charts can be displayed on the Dashboard.
Typical questions & settings
| Question | Model | Break down by | Period / parameters | Additional option |
|---|---|---|---|---|
| Revenue development over time“How has our revenue developed since the beginning of the year – by revenue type?” | Total | By Revenue Type | Start Date: 01/01/YYYY | Include Trend: On (for preview) |
| Projects with the highest revenue“Which projects deliver the highest revenue in period X?” | Total | By Project | Start/End Date | – |
| Comparing projects over time“How do projects differ month over month?” | Comparison | By Project | e.g. last quarter | – |
| Future forecast based on current trends“What will the rest of the annual revenue look like if the trend continues?” | Total | By Revenue Type | – | Include Trend: On |